Investigate how signals transform from the time domain to the frequency domain. Generate sine, square, pulse, and sawtooth waves to observe their frequency spectra in real time using our interactive simulator.
Signals are everywhere — from audio recordings to wireless communication — and each signal carries information through its unique waveform. But what happens when these signals are viewed in frequency space?
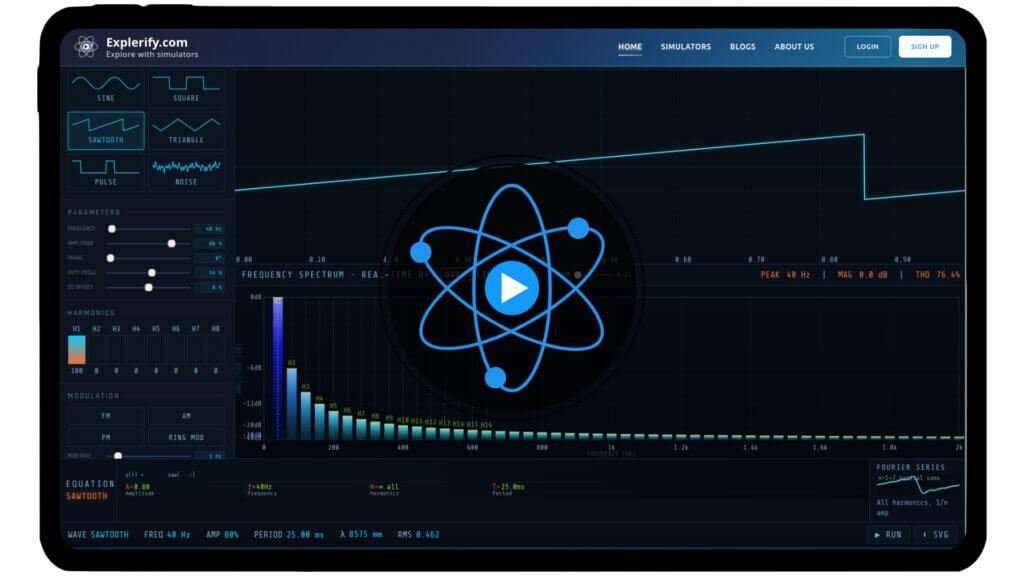
With our interactive waveform spectrum simulator, you can generate sine, square, pulse, and sawtooth waves and observe how their frequency spectra form in real time. Adjust parameters, explore how different waveforms create distinct spectral patterns, and gain insight into how signals are analyzed in physics and engineering.
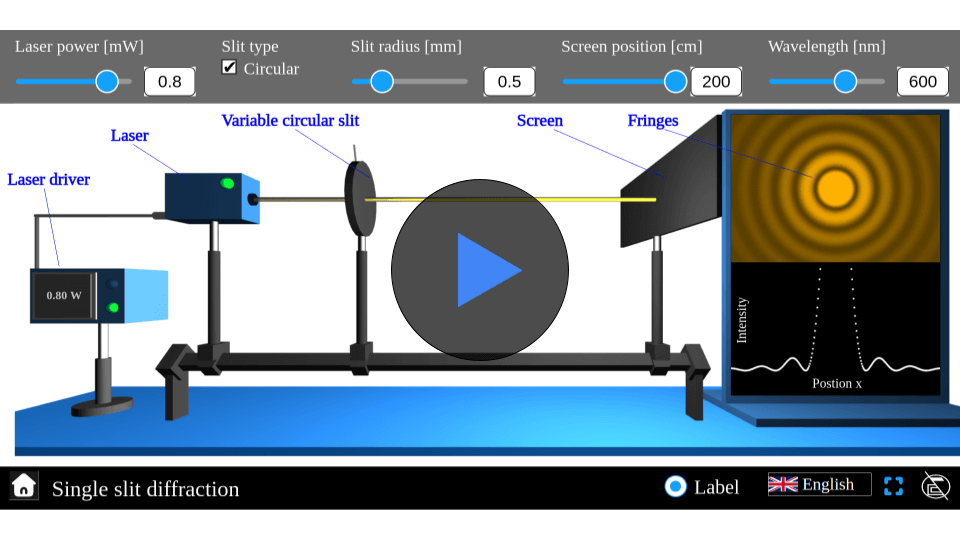
\( r_n =\sqrt {n \lambda R} \)
Mathematical description
where:
\( n \) is the ring order
\( \lambda \) is the wavelength of the light
\( R \) is the radius of the radius of curvature of the lens
Simulator
Dive into the physics of waves with interactive Waveform Spectrum simulator!
Interactive Physics Simulator – Image Formation by Concave Mirror
Share with your friends
FAQs on Waveform Spectrum
Qus 1. Where is waveform spectrum analysis used in real life?
Waveform spectrum analysis is widely used in communication systems, radar, audio engineering, medical imaging, and astronomy. It helps engineers understand which frequencies are present in a signal and how strong they are.
Qus 2. How is spectrum analysis used in wireless communication?
In wireless systems such as Wi-Fi, mobile networks, and radio transmission, spectrum analysis helps identify signal frequencies, detect interference, and optimize bandwidth usage.
Qus 3. Why do audio engineers use waveform spectrum analysis?
Audio engineers analyze the spectrum of sound to adjust bass, mid, and treble frequencies, remove noise, and improve sound quality in music production and broadcasting.
Qus 4. How does spectrum analysis help detect mechanical faults in machines?
Machines produce characteristic vibration frequencies. By analyzing the vibration spectrum, engineers can detect imbalances, bearing failures, or misalignments before the machine breaks down.
Qus 5. How is spectrum analysis used in astronomy?
Astronomers analyze the spectrum of electromagnetic waves received from stars and galaxies to determine their composition, temperature, motion, and distance.
Qus 6. How is waveform spectrum analysis used in radar systems?
Radar systems analyze the frequency spectrum of reflected waves to determine distance, speed, and direction of objects such as aircraft or ships.
Qus 7. How was spectrum analysis important in military communication during wars?
During major conflicts like World War II, engineers analyzed radio signal spectra to detect enemy transmissions, avoid interference, and improve secure communication.
Qus 8. What is a waveform spectrum?
A waveform spectrum shows how much of each frequency is present in a signal. Instead of seeing amplitude vs. time, the spectrum shows amplitude vs. frequency.
Qus 9. How do we convert a waveform into a spectrum?
A mathematical operation called the Fourier Transform converts a time-domain signal into its frequency components.
Qus 10. Why does a complex waveform contain many frequencies?
Any complex waveform can be represented as a sum of simple sine waves with different frequencies and amplitudes.
Qus 11. What information can we learn from a spectrum graph?
From the spectrum we can identify:
Dominant frequencies
Harmonics
Noise components
Bandwidth of the signal
Qus 12. Why do square or sawtooth waves show many peaks in the spectrum?
These waveforms contain multiple harmonic frequencies, which appear as peaks in the spectrum plot.
Qus 13. What happens to the spectrum when the waveform frequency changes?
The peak in the spectrum shifts to a different frequency position, showing where the signal energy is concentrated.
Qus 14. How does adding multiple waves affect the spectrum?
Each wave contributes its own frequency peak, so the spectrum shows multiple peaks corresponding to each frequency component.
Qus 15. What happens to the spectrum when noise is added?
Noise introduces many small frequency components, making the spectrum appear more spread out.